A RAG support assistant answers a refund question using a policy revision retired last quarter. Latency is normal, error rates are flat, and the trace records a successful 200 response. Yet the answer is wrong because the system can't show which passage it retrieved, which tenant owned that passage, or whether the evidence supported the claim. That's the gap between infrastructure monitoring and AI observability.
For teams building agents, RAG systems, and customer support automation, a useful trace needs to connect model calls to retrieved evidence, authorization decisions, tool actions, and outcomes. It should also help teams reproduce failures without copying sensitive data into places where it doesn't belong. If you're comparing what observability means, the practical question is whether a platform can show what happened and support a defensible response.
This list compares ten tools on tracing, evaluation, governance, and deployment fit, based on the product capabilities described below. The refund scenario is illustrative, not a benchmark, and the ranking is an editorial guide rather than a claim of measured product performance. For a regulated, multi-tenant system, the best AI observability tools are the ones that help engineers and risk teams prove what the system saw, did, and was allowed to do.
1. Langfuse
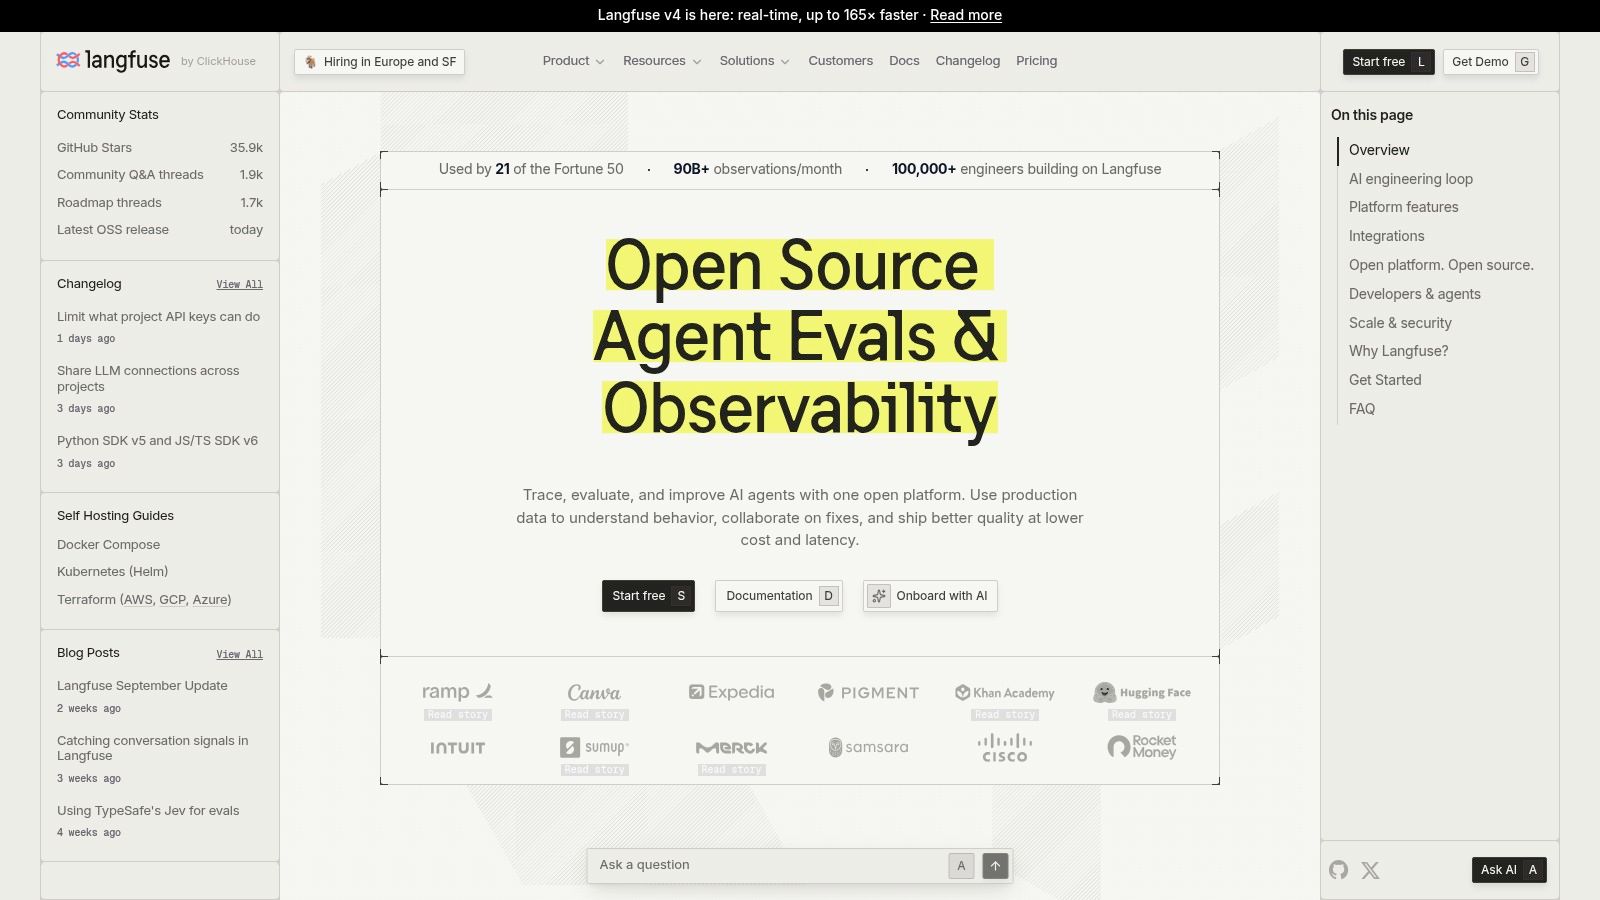
Langfuse is an open-source LLM engineering platform that combines tracing with evaluations, prompt management, and datasets. Teams can self-host it or use its cloud service, which makes it a reasonable starting point when data control matters but operating every component internally isn't desirable.
Trace capture and search help engineers inspect application behavior; dashboards and alerts support ongoing monitoring. Cost attribution, custom model definitions, and integrations offer room to adapt it to different model providers. Prompt versions, datasets, and evaluations can connect development work with production review. Teams using LangChain or LangGraph can add Langfuse to their existing stack rather than replace the application framework.
Engineering view
The open-source option gives engineers control over deployment and telemetry. Cloud pricing is presented in a calculator-style format, which can make usage easier to reason about than opaque enterprise quotes. Still, teams should test the billing model against representative traces, especially when an agent produces many observations or carries large retrieved passages.
Risk view
A trace is only useful for a tenant-boundary review if it preserves the right context. Verify that tenant identifiers, retrieval authorization, prompt and model versions, and evidence provenance appear in the records you can search and export. Advanced agent semantics may need extra instrumentation, and enterprise governance features may require work beyond the standard setup.
Practical rule: Keep raw prompts and retrieved text out of telemetry by default unless the incident workflow requires them and access is controlled.
2. Arize AI, Arize AX and Phoenix
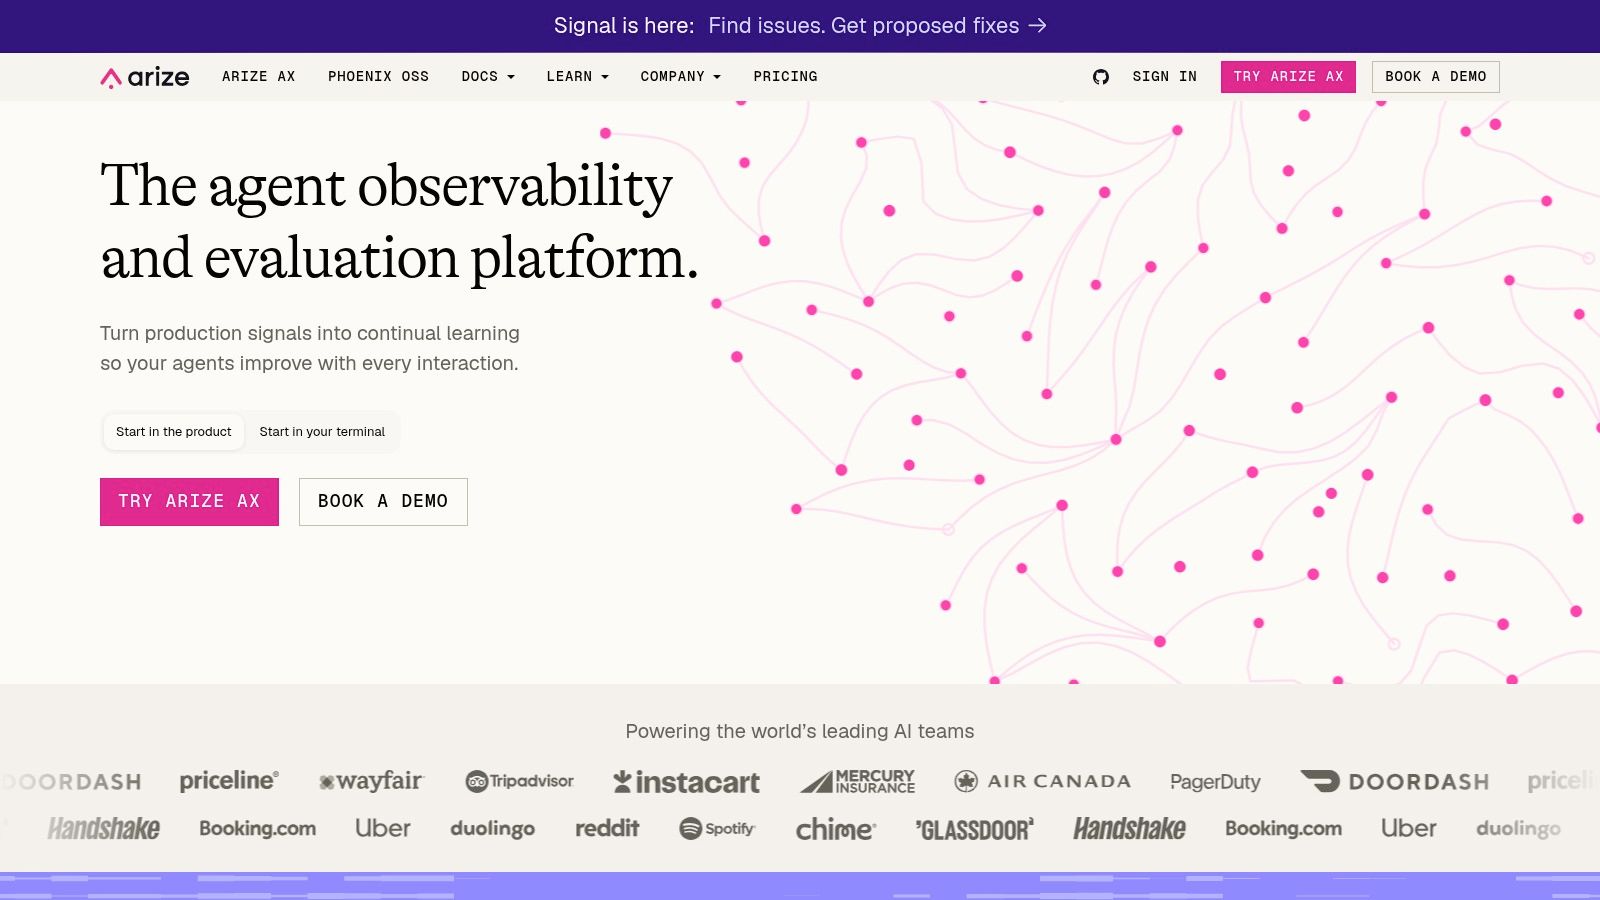
Arize AI offers two related paths: Phoenix, an open-source tool for tracing and evaluation, and managed Arize AX for broader enterprise needs. Phoenix supports traces, evaluations, datasets, experiments, and prompt management. AX adds managed capabilities aimed at scale, governance, and complex agent workflows.
Teams can instrument LLM and agent activity using OpenInference, and the platform supports online and offline evaluation, including LLM-as-judge workflows. A prompt playground and versioning help teams compare changes. The framework and provider coverage includes LangGraph, LlamaIndex, OpenAI, Anthropic, and Bedrock, giving organizations room to operate across different parts of a stack.
Engineering view
Phoenix provides a way to start locally and move toward managed AX as requirements change. That split is useful, but small teams should decide early which capabilities belong to which product. Running an evaluation workflow on Phoenix doesn't automatically settle the operational, support, or governance requirements for a managed deployment.
For teams establishing retrieval quality gates, this guide to a RAG evaluation framework can help structure the tests that should travel with production traces.
Risk view
The platform's broad instrumentation and evaluation capabilities don't by themselves prove that a retrieved source was authorized or current. Test whether your own trace schema can associate each answer with the retrieved evidence, tenant, and version of the corpus. AX's enterprise depth requires a sales conversation, so confirm deployment and access-control details before treating it as a fit for sensitive data.
3. Evidently AI
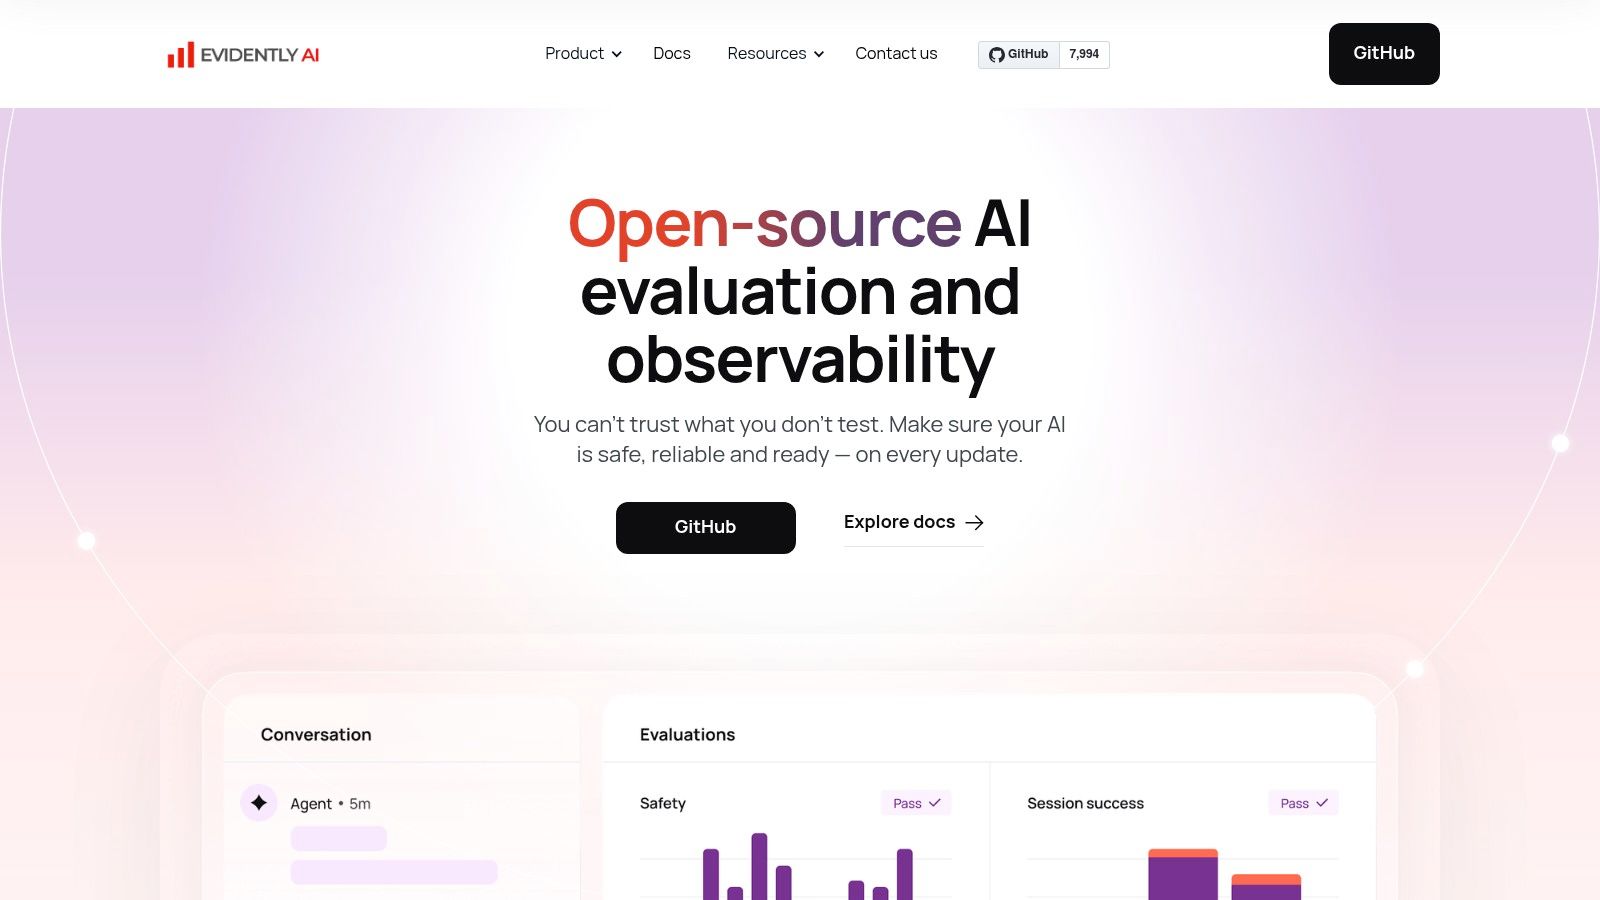
Evidently AI supports evaluation, testing, and monitoring for tabular data, text, embeddings, and LLM outputs. Its open-source library suits code-first workflows, while Evidently Cloud provides a managed interface, team features, and alerting.
The platform describes more than 100 built-in checks for drift, data quality, and model or LLM output quality, as documented by Evidently AI. Teams can run test suites in CI/CD and monitor results in dashboards. Its RAG and LLM evaluation patterns include groundedness and toxicity, giving engineers a starting point for application-specific checks.
Engineering view
The code-first foundation lets teams keep tests close to application code and release workflows. Cloud can reduce dashboard maintenance, but engineers still need to confirm how evaluation results connect to runtime traces and incident handling. LLM-specific checks may require more customization than on products built primarily for LLM applications.
Risk view
A groundedness score alone cannot establish that cited evidence is authorized, current, or valid for the active tenant. Test those conditions explicitly, including whether traces preserve source provenance and tenant context. Confirm that the evaluation methods and interface cover the modalities your system uses. Support varies by modality, and Evidently is less focused on agent behavior than some LLM-native tools.
4. LangSmith
LangSmith is a hosted observability and evaluation platform from LangChain, with particularly close integration for LangChain and LangGraph applications. It supports tracing, evaluations, datasets, prompt tools, and annotation workflows, making it a practical option for teams already building within that ecosystem.
Engineers can inspect execution steps and tool calls, then connect online and offline evaluations to those traces. Dataset versioning and review workflows help teams turn production examples into material for testing changes. Hosting options include the US and EU, while self-hosted enterprise availability may suit organizations with deployment requirements that the hosted service can't meet.
Engineering view
The main advantage is the development-to-monitoring workflow in a familiar framework. Teams can review traces without building a separate bridge between their orchestration layer and evaluation process. The trade-off is that trace and retention metering can affect costs as usage grows, and self-hosting is generally limited to enterprise plans.
Risk view
Framework integration doesn't guarantee that a trace contains every consequential event. Check whether retries, approval steps, retrieval authorization, and action results are captured consistently, including when custom components sit outside LangChain or LangGraph. Before procurement, test how the platform supports data access, retention, and export for the regions and teams that need to review incidents.
5. Datadog Agent Observability
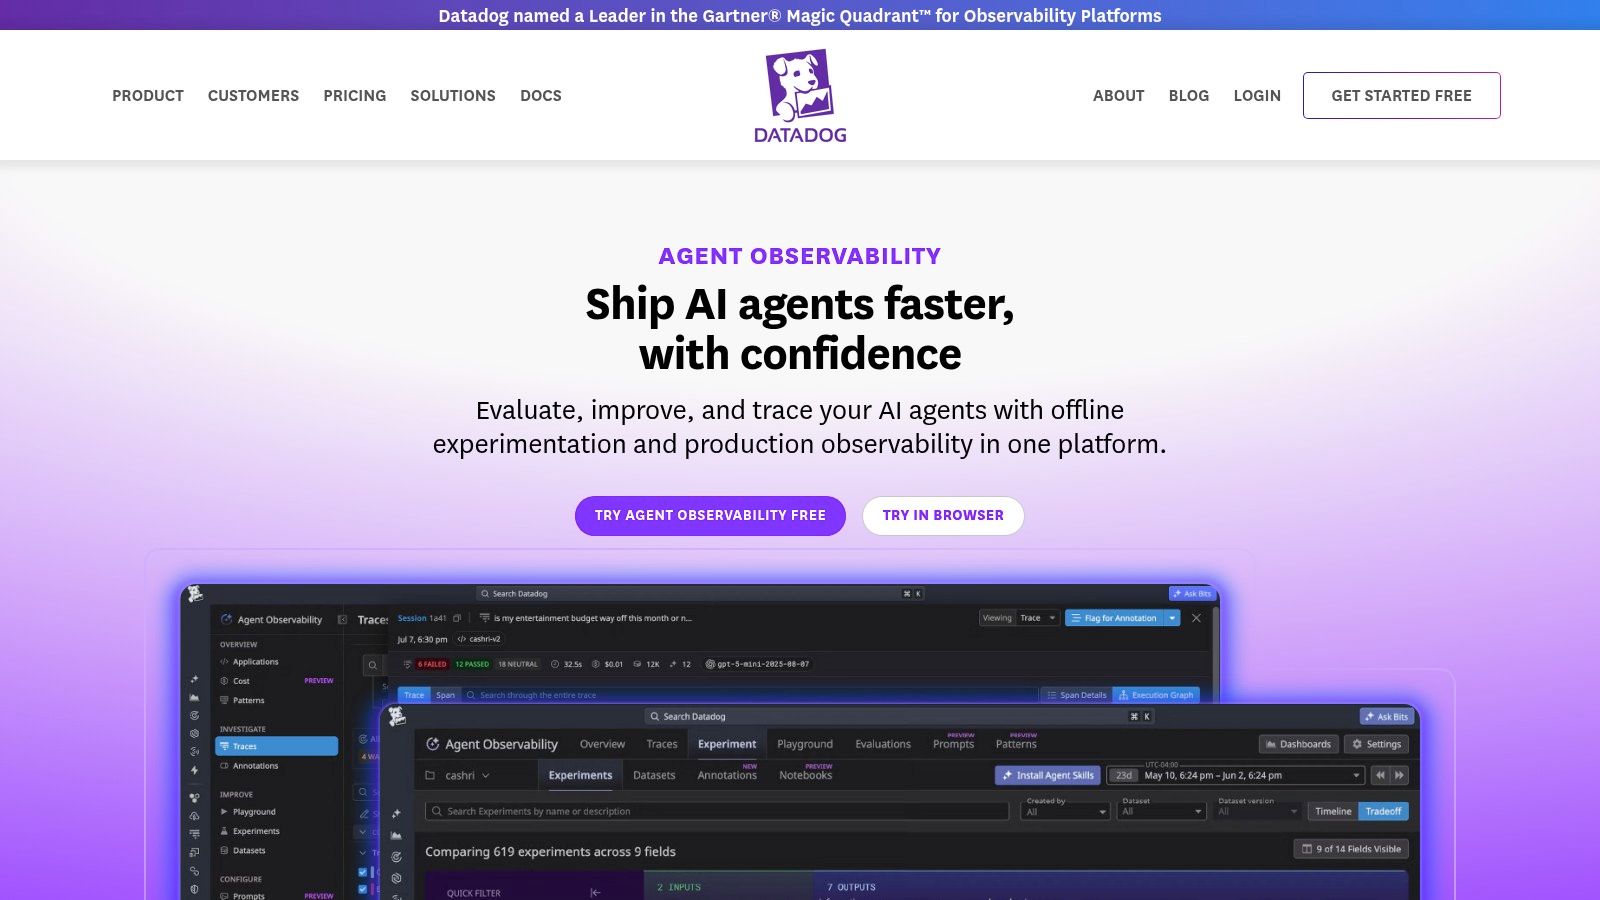
Datadog Agent Observability connects LLM and agent telemetry to Datadog's APM, logs, and infrastructure monitoring. For teams already operating services in Datadog, this can put AI incidents in the same investigation workflow as deployments and service health. The trade-off is that the evidence remains within a commercial platform without self-hosting.
The product supports end-to-end agent and LLM tracing, cost estimation across models, and integrations with providers and frameworks such as OpenAI, Anthropic, Gemini, Bedrock, LangChain, and CrewAI, as described in Datadog Agent Observability. Linking AI traces with APM and infrastructure telemetry helps engineers examine model calls, latency, and application behavior together.
Engineering view
The main engineering value is correlation with existing SRE workflows. Teams can check whether an AI failure coincided with a deployment, service issue, or infrastructure problem, rather than investigating model activity in isolation. Pricing across Datadog products and AI features can be complex, so teams should map expected usage to their own configuration before committing.
For trace design, this overview of agentic AI observability discusses connecting agent actions to service behavior.
Risk view
Datadog documents alerting, RBAC, and compliance capabilities, but buyers should verify which controls apply to their plan and configuration. A recorded model call alone does not prove that the agent used authorized evidence or that its downstream action followed policy. Test whether prompts and retrieved documents can be minimized, redacted, and limited to appropriate reviewers, then confirm that traces preserve the provenance needed to assess tenant boundaries and enforcement.
6. Weights & Biases Weave
Weights & Biases Weave adds GenAI tracing, evaluation, datasets, prompt and version management, and production monitoring to the broader W&B AI development platform. Teams already using W&B for training or fine-tuning may value the connection between model development and inference behavior.
Weave supports tracing and production monitoring for accuracy, latency, and token use. Evaluation options include LLM-as-judge, while dataset and version management can help teams compare system behavior across changes. Integrations include OpenAI, Anthropic, Bedrock, Gemini, LangChain, and DSPy.
Engineering view
Weave is a stronger fit when teams want to connect training, inference, and observability workflows than when they need only lightweight runtime traces. Collaboration, lineage, and versioning can support cross-functional review. Its primarily SaaS model and limited enterprise self-hosting may not fit organizations with strict deployment boundaries.
Risk view
Lineage is useful only when teams can inspect the evidence that matters to a particular decision. Confirm that trace versions identify the model, prompt, retrieval context, and relevant policy state, not just the experiment or dataset. For sensitive workloads, test data handling and access boundaries using realistic prompts and retrieved content before sending production telemetry.
7. WhyLabs
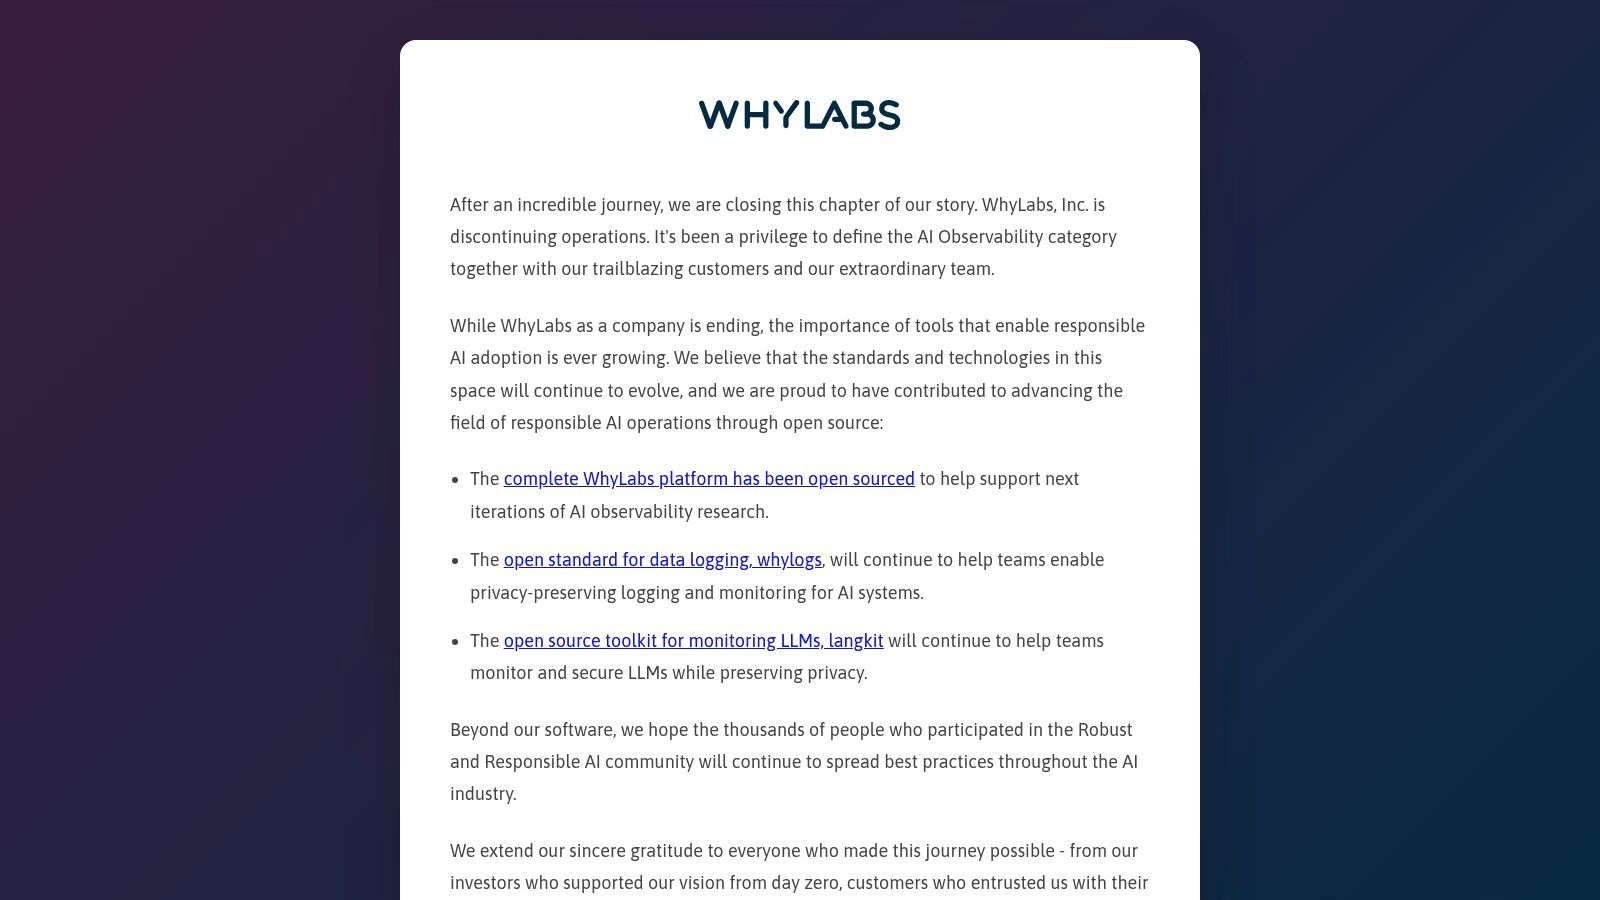
WhyLabs provides privacy-focused monitoring for AI, ML, and LLM applications. It emphasizes signals such as quality, safety, jailbreaks, toxicity, and hallucinations. Its whylogs profiling approach is designed to avoid requiring raw data in the platform, which makes it worth evaluating when data egress is constrained.
The open-source LangKit metrics cover LLM safety, quality, relevance, and toxicity. Lightweight logging and profiling can feed managed monitors, alerts, and templates for LLM applications. Monitoring spans both output and data signals, including checks for jailbreaks and hallucinations.
Engineering view
The profiling approach may help teams minimize the data they send to a monitoring system. Open-source components also give engineers flexibility in how they integrate metrics. The trade-off is that higher-scale and advanced features are sales-led, and WhyLabs is less focused on prompt interfaces than LLM-native development platforms.
Risk view
Privacy-oriented profiling isn't proof that sensitive information can never leak through telemetry. Test what each metric emits, how profiles are stored, and whether identifiers or rare values could reveal customer data. Teams should also verify how they'll investigate an incident if they've deliberately omitted raw inputs and retrieved context. Privacy and reproducibility need to be designed together, not treated as competing afterthoughts.
8. Arthur
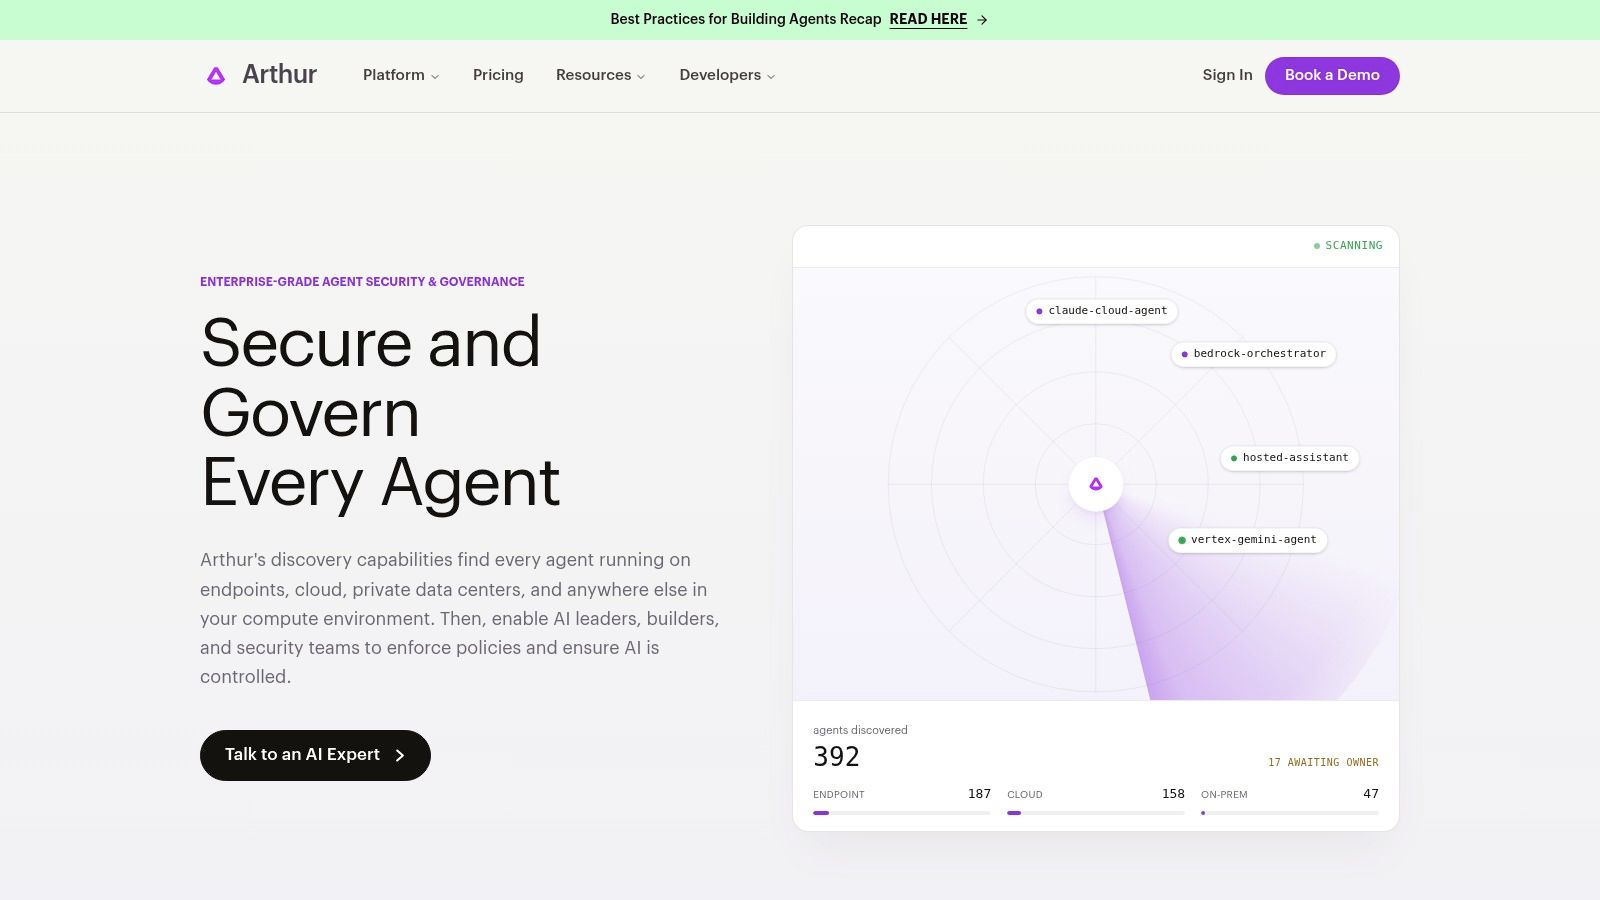
Arthur provides observability, evaluation, and governance across predictive ML, LLMs, and agentic systems. Its capabilities include tracing, custom evaluators, cost governance, and a federated architecture that can keep data in a customer VPC. That makes it a candidate for organizations with deployment or data-residency requirements.
Arthur supports LLM and agent tracing through OTEL and OpenInference, with SDKs for popular frameworks. Teams can build custom metrics and evaluations, including LLM-as-judge checks, and review drift and quality dashboards. The platform also describes spend governance, policy checks, and discovery of agents that aren't instrumented.
Engineering view
Flexible deployment and marketplace procurement paths may suit enterprise teams, but instrumentation planning matters. A platform can only report reliably on the operations the application exposes. Identify the traces needed for retrieval, tool execution, policy decisions, and outcomes before deployment, then test that the same identifiers survive across those components.
Risk view
VPC deployment can help meet data-residency constraints, but it doesn't establish tenant isolation or appropriate access by itself. Validate how tenant-scoped access, retention, export, and audit logs work in your environment. Many advanced capabilities are paid, so teams should confirm which controls are included in the tier under consideration rather than assuming all governance features are available by default.
9. Fiddler AI
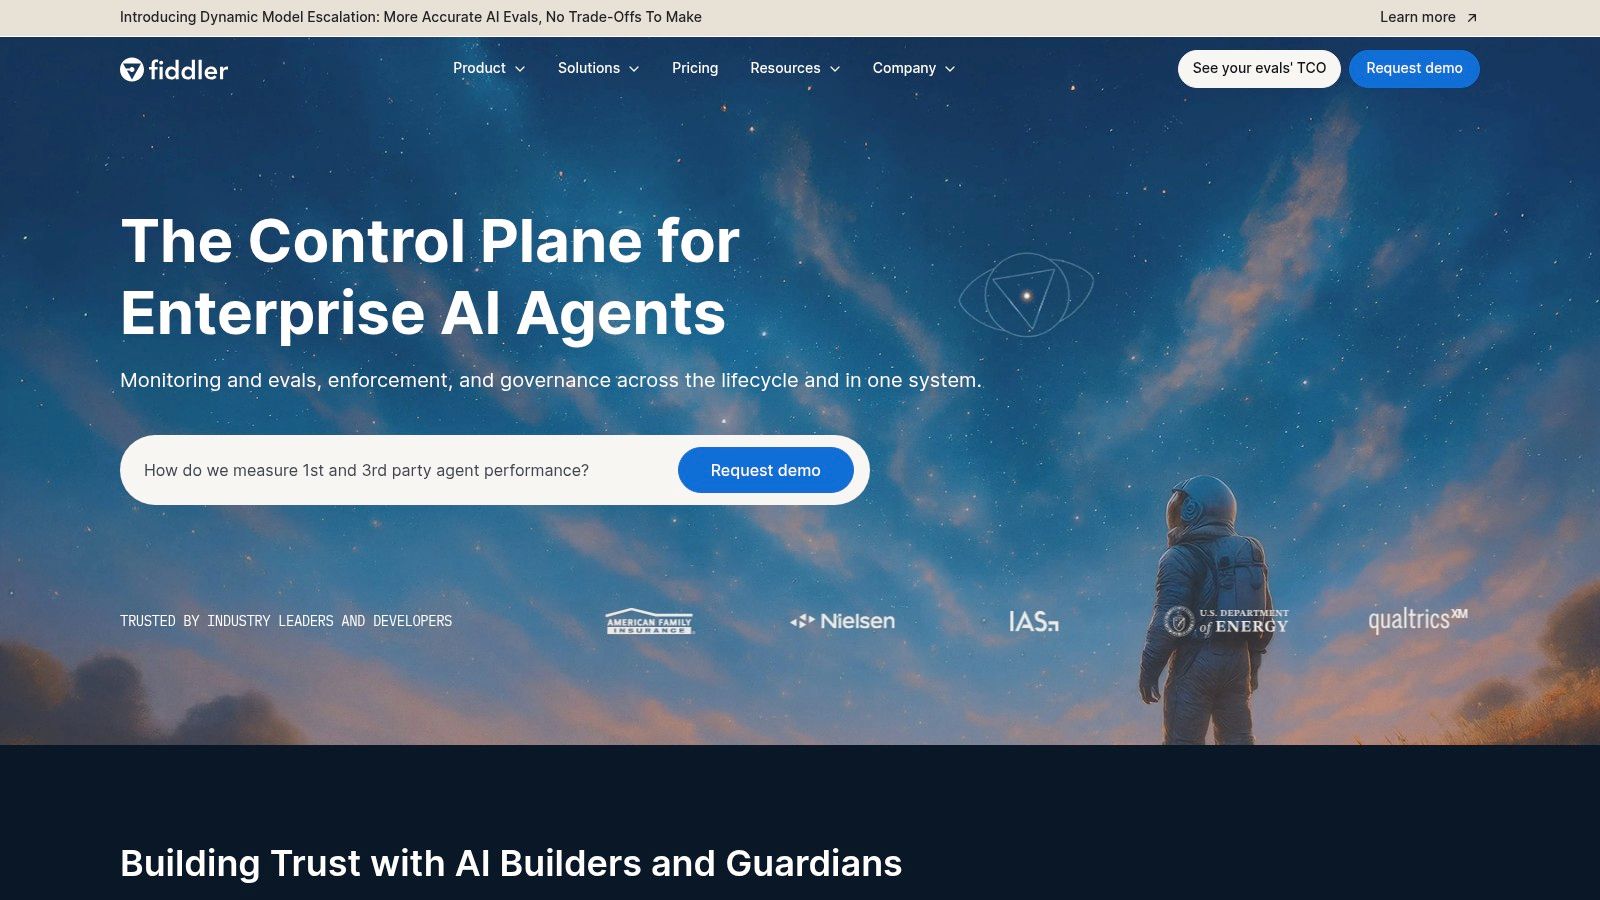
Fiddler AI presents an enterprise AI control plane spanning monitoring, evaluation, policy enforcement, and governance for predictive ML, GenAI, and agents. Its inclusion of inline controls makes it relevant when teams need to consider enforcement alongside observation.
The platform supports performance, drift, and data-integrity monitoring, as well as LLM and agent metrics. Evaluation and red-teaming capabilities can help teams probe behavior before and after deployment. An enrichment framework supports LLM metrics, while pre-prompt and post-prompt policy enforcement and redaction can apply controls around model interaction.
Engineering view
The combination of monitoring and inline enforcement may fit larger organizations that want policy controls integrated with AI operations. But enforcement in the request path changes the system's failure modes. Test latency, availability, timeout behavior, and what happens when a policy service can't make a decision before depending on it for production traffic.
Risk view
A redaction feature needs tests for both missed sensitive data and over-redaction that blocks valid work. Teams should also distinguish monitoring from authorization: hiding a field in a prompt doesn't prove that a user or agent was allowed to retrieve the underlying record. Fiddler is best suited to enterprise deployments, may require a heavier implementation, and typically uses sales-led pricing with limited transparency.
10. Galileo AI
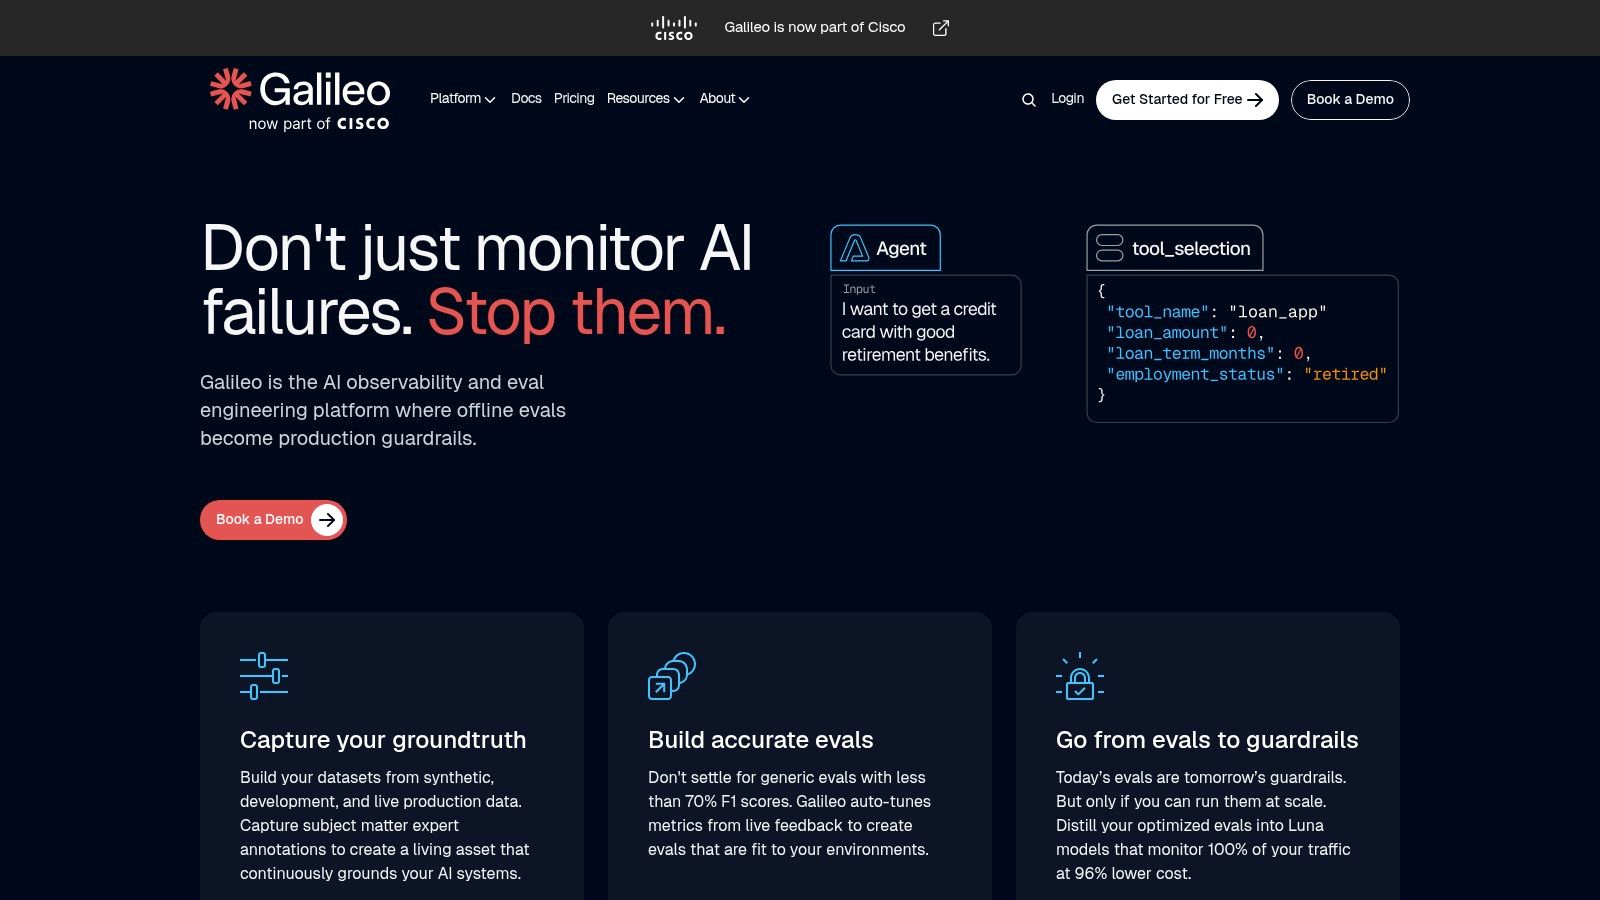
Galileo AI focuses on observability and evaluation engineering, with a path from offline evaluation toward production guardrails. Its Luna evaluator models are intended to support faster runtime checks that are less dependent on costly LLM-as-judge calls. Teams should validate that approach against their own data and response-time requirements rather than assume it will fit every workload.
Galileo supports evaluation generation and curation, continuous quality monitoring, and LLM and agent tracing. Its analysis includes RAG and groundedness checks. Those capabilities can help teams move from isolated test runs to ongoing review, but a score is useful only if the evaluation reflects the application's actual failure costs.
Engineering view
A lower-cost runtime evaluator is a hypothesis to test against representative examples, not a result to assume. Measure how its decisions compare with human labels, including cases where the system should abstain or block an action. Galileo's commercial-only model and sales-led pricing may be a constraint for teams that need open-source components or straightforward self-service procurement.
Risk view
Groundedness evaluation should examine the relationship between claims and evidence, not merely whether a response includes a citation. Test stale policies, conflicting documents, missing permissions, and unsupported actions. For a deeper treatment of evaluation design, see this guide to LLM evaluation.
Top 10 AI Observability Tools: Feature Comparison
| Platform | Core capabilities | Standout value | Best fit | Pricing & deployment |
|---|---|---|---|---|
| Langfuse | Tracing, cost attribution, evaluations, prompts, datasets | ✨ Open-source flexibility and transparent metering | 👥 Teams wanting control and broad LLM integrations | 💰 Open source or hosted cloud |
| Arize AI (AX & Phoenix) | Tracing, evaluations, experiments, prompt management | 🏆 Broad model and framework support; Phoenix can lead to managed AX | 👥 Teams scaling from local tooling to enterprise observability | 💰 Open-source Phoenix; AX enterprise pricing |
| Evidently AI | Drift, data quality, LLM testing, dashboards | ✨ 100+ checks and CI/CD-focused testing | 👥 Teams monitoring data and model quality across modalities | 💰 Open source or managed Cloud |
| LangSmith | Tracing, evaluations, datasets, annotation workflows | 🏆 Deep LangChain and LangGraph integration | 👥 Teams building with LangChain ecosystems | 💰 Hosted; self-hosting generally enterprise |
| Datadog Agent Observability | Agent traces, cost, latency, APM correlation | ✨ Connects AI telemetry to infrastructure monitoring | 👥 Organizations already using Datadog | 💰 Commercial; pricing spans Datadog products |
| Weights & Biases Weave | Tracing, evaluations, datasets, production monitoring | ✨ Links training, inference, lineage, and observability | 👥 Teams already using W&B workflows | 💰 Primarily SaaS; limited enterprise self-hosting |
| WhyLabs | Privacy-aware profiling, safety and quality monitoring | ✨ whylogs can avoid sending raw data | 👥 Regulated teams or those with data-egress limits | 💰 Open-source components; advanced tiers sales-led |
| Arthur | Tracing, evaluations, drift, spend and policy governance | ✨ Flexible deployment and data-residency options | 👥 Enterprises needing governance across ML and agents | 💰 Advanced features paid; enterprise options |
| Fiddler AI | Monitoring, evaluations, red-teaming, policy enforcement | 🏆 Inline PII/PHI redaction and controls | 👥 Enterprises prioritizing compliance and enforcement | 💰 Sales-led; pricing not transparent |
| Galileo AI | Evaluations, monitoring, tracing, groundedness checks | ✨ Luna evaluators target faster, lower-cost runtime checks | 👥 Teams turning offline evaluations into production guardrails | 💰 Commercial; sales-led |
Choose the Tool That Can Prove Its Own Evidence
Start with what your system must be able to show: which retrieved passage supported an answer, which tenant owned the data, and whether the system abstained or failed closed. Those are not just properties of a dashboard. They depend on application instrumentation, authorization design, data handling, and how teams define and retain evidence.
Shortlist two or three tools that fit your deployment and data-residency constraints. Run them against the same fixed evaluation set, including known failures from your own system. For each case, check whether engineers can connect the user request to the retrieved source, authorization decision, model and prompt version, tool call, final answer, and downstream action. Make sure the test includes cases where the evidence is stale, unavailable, or unauthorized.
A trace can show that an application returned a response without showing that the response was supported. Observability platforms help record and analyze behavior, but they don't by themselves prevent unsupported output. Grounding and evidence-control layers such as GQueries from AletheionAGI address that separate problem and are designed to work alongside existing LLMs, RAG pipelines, vector databases, and memory systems.
Treat any claimed improvement as something to verify in your environment. Record the evaluation set, denominator, system version, and limitations with each result, and preserve the negative outcomes as well as the successful ones. A platform earns its place when engineers can reproduce a failure and risk teams can inspect the evidence and authority behind the system's action.
AletheionAGI offers GQueries for grounding, authorized retrieval, and fail-closed evidence controls that can complement existing AI applications and observability platforms. To assess how its approach fits your trace, provenance, and tenant-boundary requirements, visit AletheionAGI.